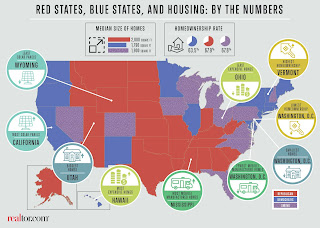
Red States vs Blue States: Housing Differences and the
Election.
It seems apropos in this pre-election period to look at
some of the differences between blue and red states, with regards to
housing. Here we go:
The median household
income in blue states is $62,564, about 23% higher than in red states,
where it is $50,820. In those blue
states, 1.4% of households bring home $500k or more (think: tech
fortunes in
California’s Silicon Valley, and seven-figure bonuses on New york’s Wall
street). These 1.4% seem small, but it
is 133% more than the percentage of households that bring in $500k or more in
right-leaning states.
The median price
of homes is $301k in blue states, which is 91%
more than in red states.
Ohio has the least expensive homes (although it is a swing
state).
Homeownership is
highest in red states, where it costs less to have a home. However, (- exception), the city with the
highest homeownership rate is San Jose (CA) even though the median list price
of homes is $767k, according to Realtor.com.
Washington DC has the lowest homeownership rate. In red states, people spend 26% of their
median household income to buy a place, while it takes 32% of a household’s
income to buy a place in a blue state.
Renting takes an
average of $1,381 a month in blue states.
This is 52% more than in red states where it costs an average of $904 per
month. “The cost of housing is directly
tied to how much land is available”, Realtor.com’s Chief Economist Jonathan
Smoke says. “The parts of the country
that have an abundance of land have the lowest housing costs”.
Click on Pix to see larger
The median size
of houses in red states is about 2,000 sq.ft.
– about 210 square feet larger than in blue states.
Oldest houses: in
blue states. Many of the blue state cities are older than their red
counterparts.
Mobile homes: the
highest concentration of mobile and manufactured homes are based in the red state
of Mississippi. The city with the lowest
percentage of these homes is San Francisco.
Solar panels: liberal states tend to have more eco-friendly
residents, who are 12% more likely to
have solar panels installed on the roof
of their homes. The most panels (in
number) were installed in California, while Hawaii has the highest percentage
of residences with the solar power source.
San Jose (CA) is the city with the highest percentage of homes with
solar panels. The fewest panels are in
the (red) state of Wyoming. Memphis, Tennessee, was the city with the smallest
percentage of residents invested in them.
Thank you for reading!
Thank you for reading!
Originally posted on Realtor.com, by Clare Trapasso.
Silicon Valley real estate specialist
Detailed, local trends etc...
Current mortgage rates


No comments:
Post a Comment