Monday, October 31, 2016

Bay Area rents are coming down a bit...

In the process of helping clients to rent their income property, I had noticed since last March/April that prices were not as strong a before, and recently had even been going down a bit.  But this is difficult to verify, since there are so few rentals locally in a given month.

I am glad to see some confirmation of that in this article from the Mercury News that I just read last Tuesday (10/25/16), in which Richard Scheinin pools several sources showing that rents have stopped going up in several cities around the Bay, and even come down a bit since last year.

It is interesting to note the Axiometrics study which found that rents in San Jose fell 3.4% since last year, San Francisco rents fell about 3.3% too, while nationwide rents overall continued a slight up curve.
Thank you for reading! - and if you like my blog, share it ;-)
Francis

Silicon Valley real estate specialist
Detailed, local trends etc...
Current mortgage rates
A worthy local non-profit to remember: Community Services Agency in Mountain View

Saturday, October 22, 2016

From the trenches: real estate in the Silicon Valley - 2nd week of October 2016

Market Watch - Coldwell Banker.

...Silicon Valley 
It has been a relatively quiet two weeks, according to our Cupertino manager. Open house traffic is steady.
Our Los Altos manager sees continued signs of seasonal adjustments although inventory is low as summer comes to a close and we move into fall.  New inventory has slowed of late.  This lack of inventory has had a direct impact on those homes which had been "lingering" on the market and agents have seen additional price reductions on homes with higher than average DOMs (days on market).  Sellers are still wishing to “test the market” by bringing their homes on at higher prices than previous sales and pendings.  However, this pricing strategy has proved to be risky, given that many buyers' expectations are that they will still need to offer over the asking.  As a result of this type of pricing strategy agents are seeing a “self-fulfilling prophecy” with these homes having little to no activity. These homes end up stagnant and linger on the market, eventually having to lower their price to generate activity. To the contrary, there has been strong activity with properties in move in condition and priced to sell.  These homes are still receiving multiple offers that typically achieve a sales price that is over asking.  This was the case with one of our recent listings, which had 24 offers.  In short, we have experienced a slowdown of homes coming on the market over the recent weeks.  And those that are coming on, when priced to induce offers, are being absorbed quickly.
The Los Gatos market under $2.5 million continues to be extremely competitive.  The market over $2.5 million is a tad slower but great properties over $2.5 continue to sell. 
The San Jose Almaden market had an average number of sales for the month with 40, which is down from 44 in August and flat with the 39 sold in 2015.  Prices were up with the median sales price at $1,320,000 for the month, up 7.8% from the previous month and 3.5% higher than the previous year.  Blossom Valley had a strong month in units sold with 94 closings, up from 88 last month and 86 last year.  The median home price of $751,250, up 4% from last month and last year at this time.  
Cambrian had a big jump from last month with 86 closings, 20 more than August and 4 more than 2015.  The median sales price was $937,500, up 3.9% from last month but down 1% from September of 2015.  
Santa Teresa had a lower number of units sold at 27, down 6 from last month and down 13 units from September of 2015.  The median sales price of $750,000, down 4.5% from last month but up a whopping 11% from September of last year. 
Willow Glen got a surge of new listing inventory this past week, going from the low 60’s count to 83 active listings. Agents are reporting slower traffic at open houses, particularly if the property has been on the market more than 2 weeks. However, some properties are still selling quickly with multiple offers, but typically the offers are at or just slightly above the list price.

Thanks for reading! 
Francis


Silicon Valley real estate specialist
Detailed, local trends etc...
Current mortgage rates

Coming soon: Shredding and E-waste day, organized by
Coldwell Banker in Los Altos Oct.29, 2016
Please contact me for more details.              

Wednesday, October 19, 2016

Housing Differences and the Election - Red States vs Blue States.

Red States vs Blue States: Housing Differences and the Election.

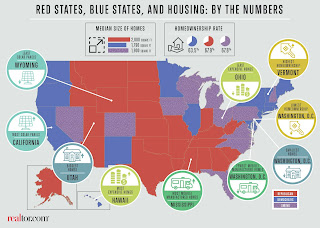
It seems apropos in this pre-election period to look at some of the differences between blue and red states, with regards to housing.  Here we go:

The median household income in blue states is $62,564, about 23% higher than in red states, where it is $50,820.  In those blue states, 1.4% of households bring home $500k or more (think: tech
fortunes in California’s Silicon Valley, and seven-figure bonuses on New york’s Wall street).  These 1.4% seem small, but it is 133% more than the percentage of households that bring in $500k or more in right-leaning states.

The median price of homes is $301k in blue states, which is 91% more than in red states.
Ohio has the least expensive homes (although it is a swing state).

Homeownership is highest in red states, where it costs less to have a home.  However, (- exception), the city with the highest homeownership rate is San Jose (CA) even though the median list price of homes is $767k, according to Realtor.com.  Washington DC has the lowest homeownership rate.  In red states, people spend 26% of their median household income to buy a place, while it takes 32% of a household’s income to buy a place in a blue state.

Renting takes an average of $1,381 a month in blue states.  This is  52% more than in red states where it costs an average of $904 per month.  “The cost of housing is directly tied to how much land is available”, Realtor.com’s Chief Economist Jonathan Smoke says.  “The parts of the country that have an abundance of land have the lowest housing costs”.

red vs blue states in the US
Click on Pix to see larger

The median size of houses in red states is about 2,000 sq.ft.  – about 210 square feet larger than in blue states. 

Oldest houses: in blue states. Many of the blue state cities are older than their red counterparts.

Mobile homes: the highest concentration of mobile and manufactured homes are based in the red state of Mississippi.  The city with the lowest percentage of these homes is San Francisco.

Solar panels:  liberal states tend to have more eco-friendly residents, who are 12% more likely to
have solar panels installed on the roof of their homes.  The most panels (in number) were installed in California, while Hawaii has the highest percentage of residences with the solar power source.  San Jose (CA) is the city with the highest percentage of homes with solar panels.  The fewest panels are in the (red) state of Wyoming. Memphis, Tennessee, was the city with the smallest percentage of residents invested in them.
Thank you for reading!

Francis

Originally posted on Realtor.com, by Clare Trapasso.

Silicon Valley real estate specialist
Detailed, local trends etc...
Current mortgage rates
Coming soon: Shredding and E-waste day, organized by
Coldwell Banker in Los Altos Oct.29, 2016  
Please contact me for more details.