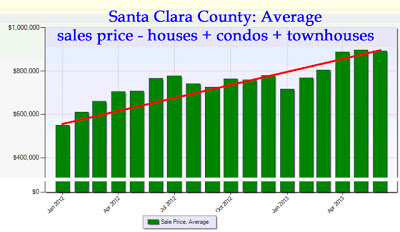
These graphs that I just pulled show the amount of increase in average prices in a year and a half, and illustrate how indeed this is a factor in a possible slow-down of the activity.
They also show something that is unusual: prices did not really go down a lot at the end of 2012. On previous studies I showed how prices really adjusted towards the end of the year, in 2011 and 2010. But the market stayed strong at the end of 2012.
Finally these graphs show that indeed prices are (somewhat) flattening at this point, at least in the case of the County of Santa Clara.
If you have any area of interest, very local or at the City level, let me know and I will publish it for you.
Thanks for reading, as always!,
Francis
Current Mortgage rates
Non-profit organization worth noting: Partners for New Generations.


No comments:
Post a Comment