Showing posts with label bay area statistics. Show all posts

Friday, April 8, 2016

Bay Area: some relief for homebuyers?

As demand for housing remains quite strong locally in the San Francisco Bay Area and the Silicon Valley, are homebuyers going to see some relief coming their way soon?

Inventory is key to this equation.  Look at the situation the way it was last year, and what it is today, in the cities around Palo Alto and Los Altos:

Inventory for all houses, condominiums & townhouses, a year ago,
-------------  on March 31, 2015 ----- Inventory today - April 6 2016:
Los Altos:...............27               - - - - - - - - - -        29
Palo Alto: ...............45               - - - - - - - - - -        51
Mountain View:......26              - - - - - - - - - - -       43
Sunnyvale:..............46              - - - - - - - - - - -       82
Menlo Park: ...........21              - - - - - - - - - - - -     30
Cupertino: ..............31              - - - - - - - - - - - -     67
For Mountain View, Sunnyvale and Cupertino, this is almost twice as many homes for sale now than last year.  This could mean some relief for homebuyers.

From the trenches, dealing with the market on a daily basis, I think many agents would agree that the activity shows signs of leveling a bit - but we have to characterize this with a few caveats: buyers still need to be completely pre-approved, and very motivated.  It's just that where we could expect 10 offers, it seems that we are seeing, say, half that amount lately.  Several factors are in play here, influencing activity:

- overpriced listings will stay on the market for a while, (& there are a few more lately),
- the increase in price is not as high as it has been until now,
- the best properties (most desirable) will always be the ones with the most activity,
- more homes are coming now on the market, and this is normal for the time of the year,
- inventory is -still- not a lot higher in PA, Los Altos and Menlo Park,
- and finally, some buyers have been priced out of the market (hence, a bit less competition).

Whether you are a buyer or a seller, I think a real estate professional has never been so important in helping you see more clearly, and separate the hype from the facts.

Stay tuned! as things change pretty fast here in the Silicon Valley!

Thanks for reading,
Francis

Silicon Valley real estate specialist
Detailed, local trends etc...
Current mortgage rates
A worthy local non-profit to remember: Community Services Agency in Mountain View - our last event there.


Tuesday, September 9, 2014

Average prices in the SF Bay local Counties - evolution.

To piggy back on an earlier blog of mine, dating back to January of this year, here is an update to the graphs showing the increase in average prices in both the counties of Santa Clara and San Mateo; the figures include both the houses and the condominiums/townhouses.

As always, one has to be careful with statistics: a few very high priced homes can skew the average to a high number, even though nothing much else has happened in the market place.

A few things to note:
- In general, average prices go down at the end of the year and until January.  Last year was shielded in large part from this phenomenon: prices went down, but not much.  We will see if this year acts more "normal".
- The total number of homes (houses and condos) for sale last year at the end of August was 1,852 in the Cnty of Santa Clara, and it is now 1,778  - a little lower.  Still a lack of inventory ...
- Prices were an average of $715.7K in the County of Santa Clara in Jan of 2013, and they are now $992.5K, a 38.7% increase !
- From the graphs below, it seems that averages move faster up and down in the County of San Mateo than in the County of Santa Clara.  I believe it reflects the fact that a lot more properties went into the averages in SCC than in SM Cnty: 25,705 listings for Santa Clara County, vs 10,619 for San Mateo County.  The more properties you have, and the more the averages are going to be representative of the real market, instead of the specifics of the homes.  To say it simply, if you have a few very high properties, they will have less of an effect on the average of 25,000 sales vs the average of 10,000 sales.

One final note: the inventory of homes for sale in January of 2014 was around 900, about half of what it is now.  So it is a better time to look for a home!  Also, many trades linked to real estate, like property inspection services, termite companies, stagers, report being extremely busy right now (beg. of Sept.).  This could mean that inventory may increase soon...

County of Santa Clara:


County of San Mateo:


Thank you for reading,
Francis

Silicon Valley real estate specialist
Detailed, local trends etc...
Current mortgage rates

non-profit organization worth noting: Partners for New Generations - now called:
Mentor Tutor Connection.

Monday, July 1, 2013

Price increase in the Silicon Valley

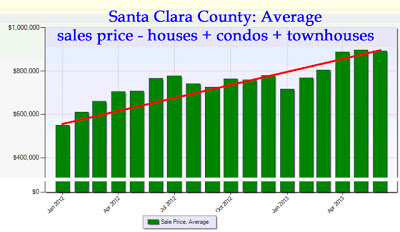
To piggy up on my last blog (is the market slowing down?) here is the evolution of sales prices of houses and CID's (common interest development = condos and townhouses).

These graphs that I just pulled show the amount of increase in average prices in a year and a half, and illustrate how indeed this is a factor in a possible slow-down of the activity.

They also show something that is unusual: prices did not really go down a lot at the end of 2012.  On previous studies I showed how prices really adjusted towards the end of the year, in 2011 and 2010.  But the market stayed strong at the end of 2012.

Finally these graphs show that indeed prices are (somewhat) flattening at this point, at least in the case of the County of Santa Clara.


If you have any area of interest, very local or at the City level, let me know and I will publish it for you.
 
Thanks for reading, as always!,
Francis
 
Local market trends
Current Mortgage rates

Non-profit organization worth noting: Partners for New Generations.

Wednesday, April 24, 2013

An unbalanced market...

As we advance deeper inside the year 2013, the sales figures start showing how much the market has been ... to put it mildly, unbalanced.
Here in this statistical recap coming from the CAR (California Assocation of Realtors) one can see how much the various Counties in the Bay Area have appreciated from March 2012 to March 2013.

Even though this is not exactly the 1-year appreciation, but only the jump from one month in 2012 to the same month in 2013, it certainly gives a good idea of the appreciation we are going to see at the end of the year, because in fact it is pretty much the same story month after month.


It sure is a steep rate of appreciation.  What do you think? Are we looking at a bubble, or does it reflect accurately the health of the local economy?

Thank you for reading,
Francis
Silicon Valley Real Estate
Smart stats